Math 110 Review for Exam 3 Spring 2002
1. A family has 3 children, find the probability that the family has three daughters, given that the
family has at least two daughters.
2. If p(E) = 5
9,p(F0) = 3
9and p(E∪F) = 8
9, find p(E|F).
3. A personal computer manufacturer buys 45% of his chips from Japan and the rest from America.
0.8% of the Japanese chips are defective, and 0.6% of the American chips are defective. Use a tree
diagram to find the following probabilities: (a) A chip is defective, given that it is made in Japan.
(b) A chip is defective and it is made in Japan.(c) A chip is defective.
4. A couple has two children. (a) What is the probability that both children are girls, given that
one of the children is a girl? (b) What is the probability that both children are girls, given that the
oldest child is a girl.
5. In order to determine the
effect their salespersons have on
purchases, a department store
polled 700 shoppers regarding
whether or not they made a pur-
chase and whether or not they
were pleased with the service.
Poll Results
Happy with Not Happy with Total
the Service the Service
Made Purchase 151 133 284
No Purchase 201 215 416
Total 352 348 700
The results can be found in the table on the right. Find the probabilities of the following events: (a)
A shopper made a purchase. (b) A shopper was happy with the service. (c) A shopper was happy
with the service and made a purchase. (d) A shopper made a purchase given that he or she was
happy with the service. (e) A shopper made a purchase given that he or she was not happy with the
service.
6. The speed, in miles per hour, of forty randomly monitored cars on I-65 near Evergreen, Alabama,
were recorded as follows:
69 71 79 61 76 78 76 67 84 63 72 77 69 73 77 63 71 61 65 73
64 78 80 76 62 70 72 62 74 68 57 69 76 79 67 68 60 51 71 81
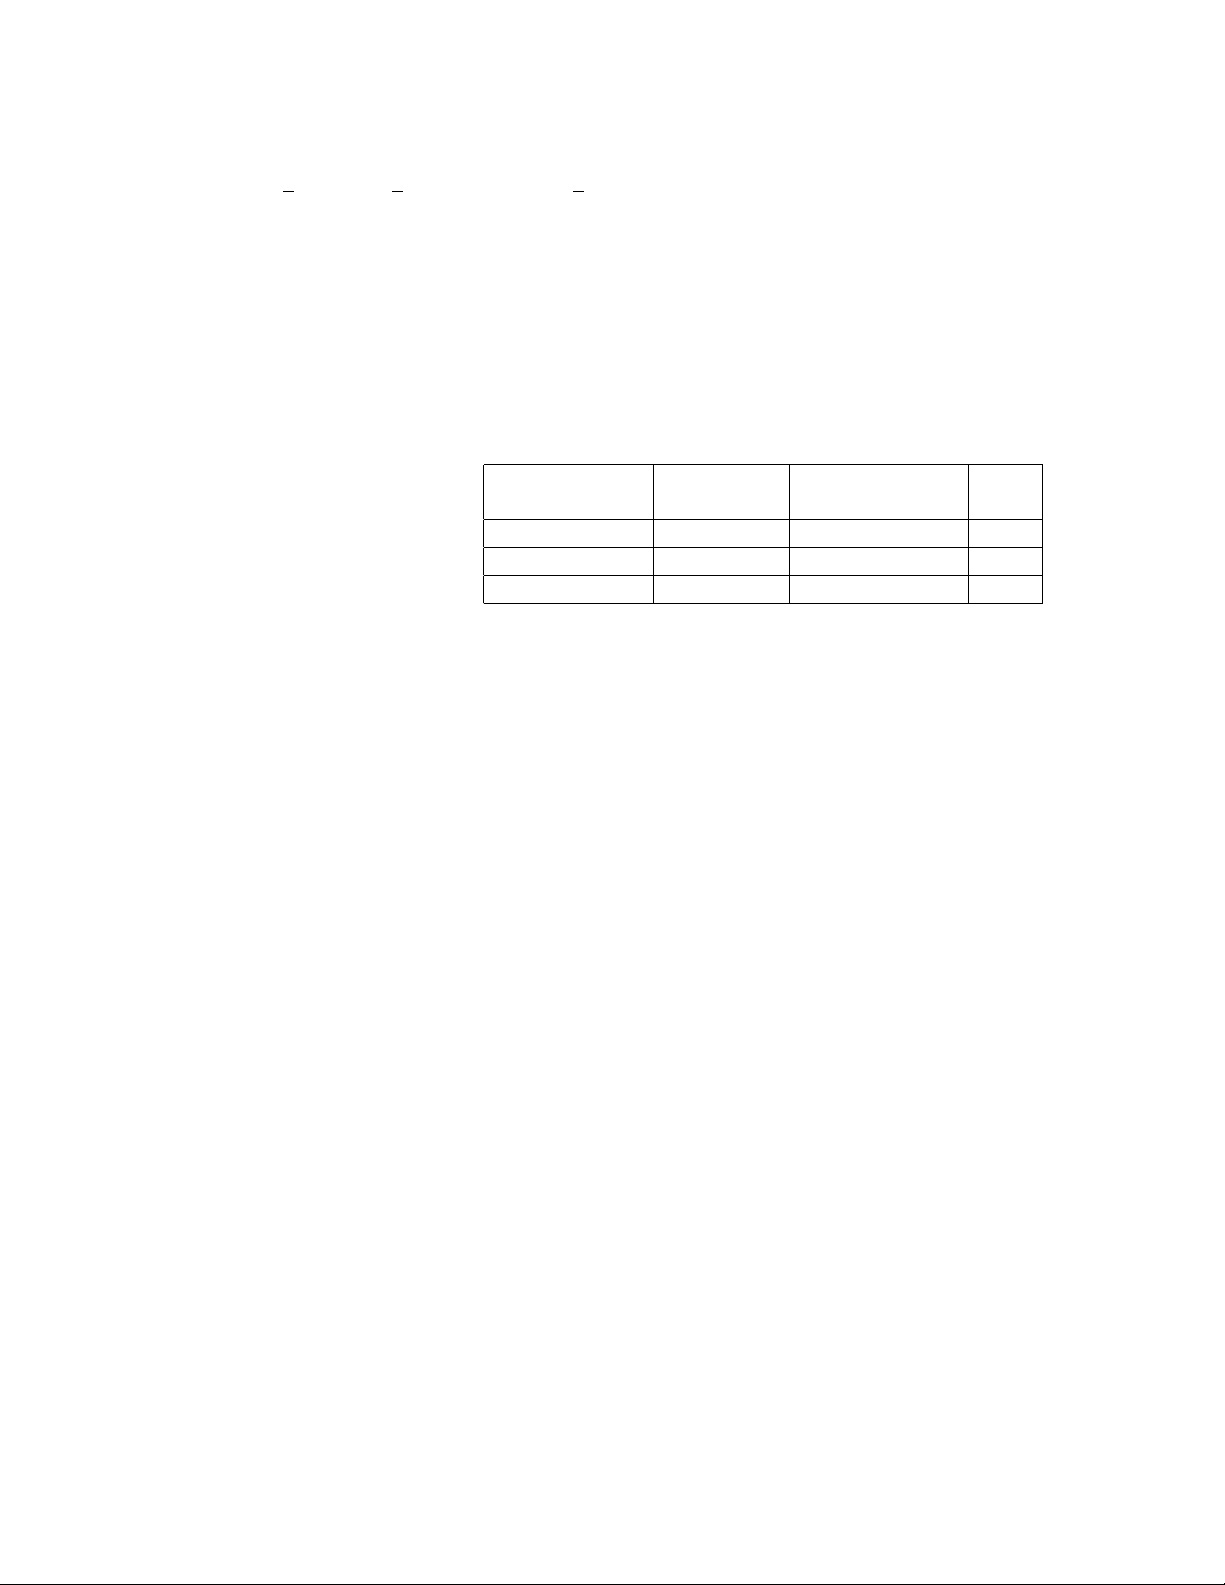
(a) Organize the data by creating a frequency distribution. (Group the data into six intervals.) (b)
Construct a histogram to represent the data. (c) What percentage of cars was going 75 miles per
hour and faster.
7. (a) Explain the difference between relative frequency and relative frequency density.
(b) When is relative frequency density used as the vertical scale in constructing a histogram? Why?
8. Consider the following set of quiz scores from a Math 110 class.
10685478810975108777858488106898108
(a) Find the mean. (b) Find the median. (a) Find the mode.
9. Consider the quiz scores from problem 3. (a) Find the variance and the standard deviation. (b)
What percentage of data lies within one standard deviation?
10. The amount of time between taking a decongestant and getting relief is normally distributed
with a mean of 29 minutes and a standard deviation of 5 minutes. Find the probability that the time
between taking the medication and getting relief is between 25 and 35 minutes.
11. The shrinkage in length of a certain brand of blue jeans is normally distributed with a mean
of 1.45 inches and a standard deviation of 0.35 inches. What percentage of this brand of jeans will
shrink between 1 and 2 inches?
12. The average lifetime for a car battery of a certain brand is 170 weeks, with a standard deviation
of 10 weeks. If the company guarantees the battery for 3 years, what percentage of the batteries sold
would be expected to be returned before the end of the warranty period?
13. Scholastic Aptitude Tests are scaled so that the mean score is 500 and the standard deviation
is 100. What score does a student need to be in the top 20%?